SEC504: Hacker Tools, Techniques, and Incident Handling
SEC504Offensive Operations

Baseline analysis is a critical technique useful across a multitude of artifacts commonly used in digital forensics and incident response.

Baseline analysis is a critical technique useful across a multitude of artifacts commonly used in digital forensics and incident response. In its simplest form, baseline analysis consists of comparing a suspect data set with a “known good” data set to identify outliers. Baselines can take the form of file hash sets, system “gold images”, comprehensive file listings like the VanillaWindowsReference, and common process lists like you might find on the SANS Hunt Evil poster. Assuming the existence of an uncompromised baseline, it is difficult to imagine a scenario where baseline analysis would not be helpful! Memory baselining has long required a manual approach, which is why I was so excited to see Csaba Barta’s original release of baseline plugins for the Volatility memory analysis suite in 2014. I have used these plugins to successfully identify outliers in many memory images and we have put them to use in our SANS FOR508 computer intrusion scenario for many years. With this in mind, I reached out to Csaba to gauge interest in updating this capability to take advantage of the new Volatility 3 release. Out of these conversations, Memory Baseliner was born.
Memory Baseliner is far more than just a port of the original plugins to Volatility 3. Csaba re-imagined the problem and created an incredible tool suite useful to baseline a single memory image or an entire collection of images. He also utilized the new library features of Volatility 3 to build a standalone tool, which could serve as a model for other developers to create similar specialized tools. Seeing is believing, so let’s take a tour of this exceptional tool.
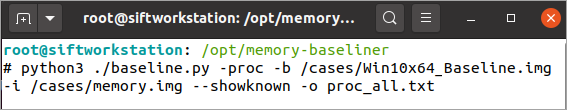
Figure 1: Command line for creating a process baseline
Figure 1 demonstrates the command for performing a baseline comparison of in-memory processes using the “-proc” argument. Notice that two memory images are being provided: a baseline image using the “-b” argument and the suspect image using the “-i” argument. Output can be saved to a file (“-o” option) and can be subsequently analyzed in your favorite spreadsheet tool or viewer. No matter how you slice it, baselining will result in a lot of data, so I recommend using the “--showknown” option to output both known (in the baseline) and unknown (not in the baseline) data into one large output file that can be filtered in many different ways. When performing analysis, take the time to peruse the various columns as there is a lot of information available, including process name, command line, parent process, loaded DLLs, import table hashes (when available), KNOWN/UNKNOWN status (“KNOWN” indicates the item was present in your baseline), and even frequency of occurrence information for each process (labeled “BASELINE Fo O” and “IMAGE Fo O” for the baseline and suspect images respectively).
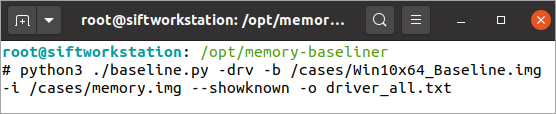
Figure 2: Command line for creating a driver baseline
Baselining can also be accomplished for drivers with the “-drv” option. While malicious drivers are becoming rare thanks to Windows security upgrades, they still exist in the wild and if you find them you are almost guaranteed of an advanced attack. Further, most analysts are less familiar with common drivers than common process names, so removing the noise via baselining can greatly accelerate analysis.
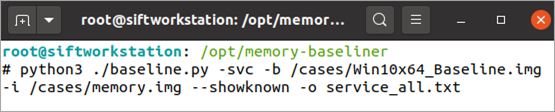
Figure 3: Command line for creating a service baseline
Finally, Memory Baseliner can also baseline Windows services, one of the most commonly abused parts of the operating system. Most services are created during system installation and hence a memory baseline can do an excellent job of eliminating a majority of them.
Analysis Techniques
Memory Baseliner provides a wealth of information and there are many diverse ways to approach analysis. Here are some of my favorite ways to format and pivot on the available data.
Output Formatting
Process Baselining
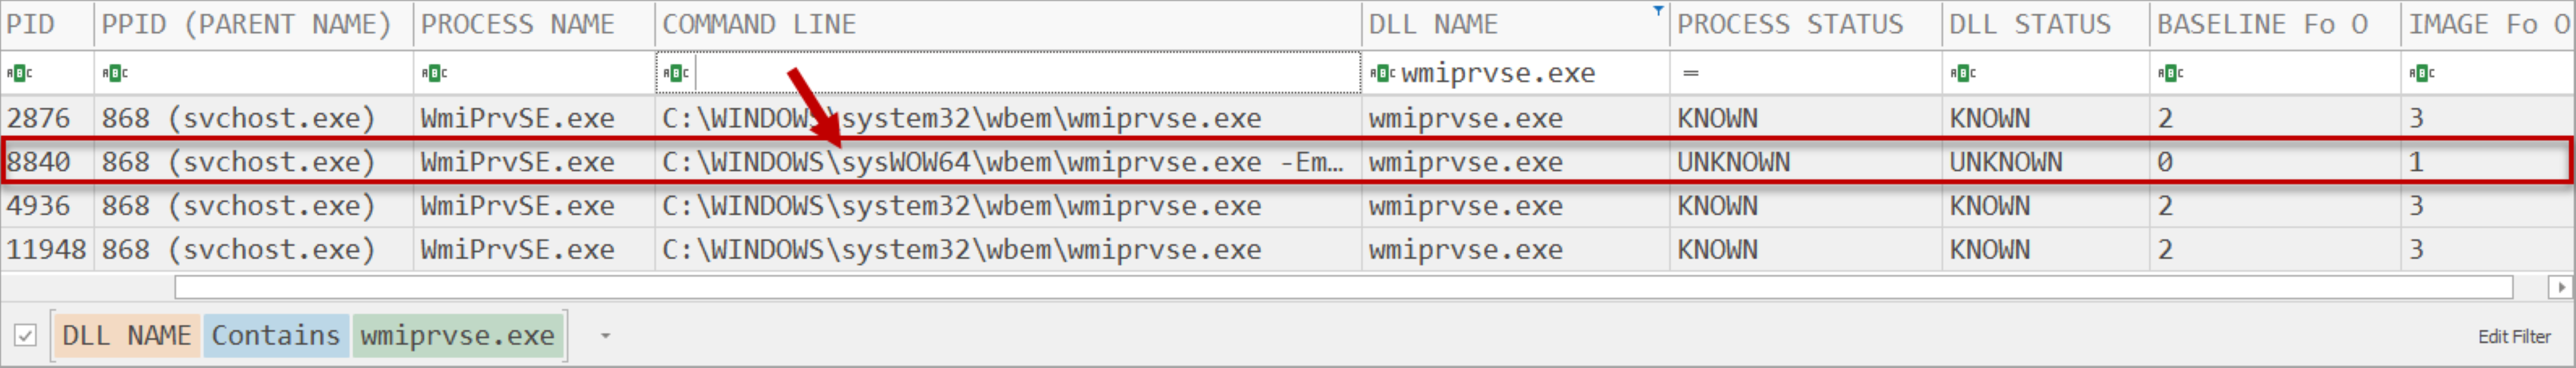
Figure 4: Command line comparisons showing the 32-bit version of wmiprvse.exe not present in baseline
Driver Baselining
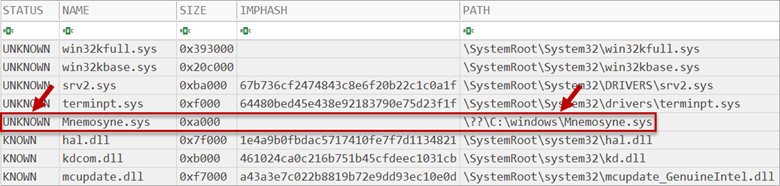
Figure 5: A driver loaded from an unusual location and not present in the baseline
Service Baselining
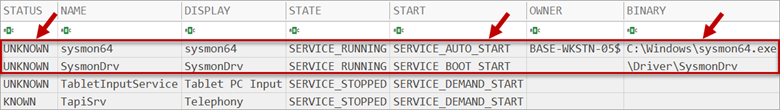
Figure 6: Sysmon was installed in the suspect image but not present in the baseline
Stacking
Least frequency of occurrence analysis, also known as “stacking”, is one of my favorite analysis techniques for intrusion analysis. Its power rests in the fact that malware artifacts are much rarer than those associated with normal system activity. If one were to collect all the executables, drivers, DLLs, or services across many systems, the items associated with malware should be among the least frequently occurring. A DLL that exists on 73 systems is much less likely to be malicious than a DLL existing on only one system. Memory Baseliner facilitates stacking across a collection of memory images. Processes, DLLs, drivers, and services can be stacked, allowing the least frequently occurring items to bubble up to the top of the output for easier identification. Like all analysis techniques, do not expect this to be the miracle technique that accomplishes instant malware identification. There are many unique snowflakes in an enterprise, even among systems of similar builds (which is what you should be targeting with this technique). You will likely need to work through many least frequently occurring false positives to find evil, but at a minimum this technique is adept at greatly reducing the dataset and providing an alternate means to look for outliers.
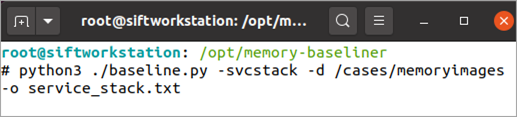
Figure 7: Command line for performing a service stack analysis across a directory of memory images
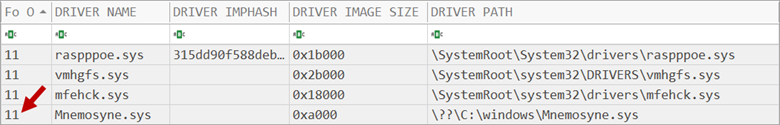
Figure 8: The previously identified Mnemosyne driver appears to be present on many systems
In the example shown in Figure 8, after stacking services across eleven memory images it became clear the previously identified “Mnemosyne.sys” (Figure 5) is common in the environment as it was present on eleven out of eleven systems audited. Further analysis identified it as legitimate security software present in an unusual folder.
Patience (or JSON)
The biggest hurdle of Memory Baseliner is it can take a long time to complete. It is not unusual for baseline output to require 15 minutes to generate. This can be significantly sped up after the first attempt with the use of the jsonbaseline feature. This feature creates a JSON file for the “known good” memory image which can be loaded in the future to eliminate the time necessary to re-analyze that memory image. The --savebaseline argument will create the JSON file allowing the --loadbaseline argument to be subsequently used to take advantage of the baseline in the future. Both arguments also require the --jsonbaseline argument referencing the name of the JSON file. When using this feature, remember that JSON files are specific to the type of analysis being conducted, meaning you will need separate JSON files for process, driver, and service analysis. Once created, you also no longer need to point to (or have) the baseline memory image if a JSON file is being used. Since baseline JSON output is typically under 1MB, this makes them much more portable than full memory images.
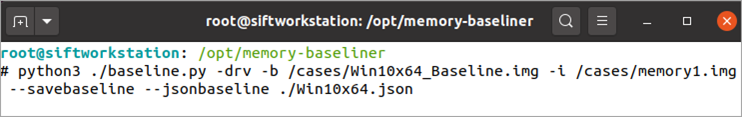
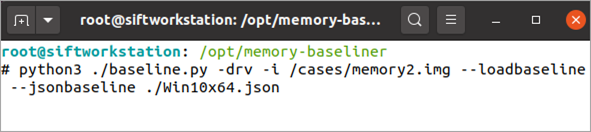
Figure 9: Saving and subsequently using a baseline. Notice the baseline memory image is not required after JSON file creation
Installation
Getting Memory Baseliner set up in a Linux environment (including the SIFT Workstation) requires just a few steps. The simplest way is to use a standalone version of Volatility 3 just dedicated to this tool instance. The following instructions assume previous installation of Git and Python3.
Conclusion
First, a big thank you to Csaba Barta for creating Memory Baseliner. We now have a modern means to perform baseline comparisons of four of the most important objects found in Windows memory images: processes, DLLs, drivers, and services. With well thought out options and the ability to extend analysis to many memory images via stacking, this tool provides a diverse set of tools to extend your memory analysis capabilities. Happy hunting!
Chad Tilbury has spent over twenty years conducting computer crime investigations ranging from hacking to espionage to multimillion-dollar fraud cases. He is a SANS Institute Fellow and co-author of FOR500 Windows Forensic Analysis and FOR508 Advanced Incident Response, Threat Hunting, and Digital Forensics. Find him on Twitter @chadtilbury
