Training
Get a free hour of SANS training

Experience SANS training through course previews.

Learn More
Learning Paths
Can't find what you are looking for?

Let us help.

Contact us
Resources
Join the SANS Community

Become a member for instant access to our free resources.

Sign Up
For Organizations
Interested in developing a training plan to fit your organization’s needs?

We're here to help.

Contact Us
Talk with an expert

Digital Forensic SIFTing: Colorized Super Timeline Template for Log2timeline Output Files

Authored byRob Lee
Rob Lee

Last Month at the SANS360, I promised the release of the Timeline Template to be used to automatically colorize your timelines.

Review on Timeline Creation:

  1. Mounting Evidence Files
  2. Automated Timeline Creation
  3. Targeted Timeline Creation
  4. TIMELINE CREATION CHEAT SHEET

The Timeline Color Template in EXCEL 2007+

The EXCEL TEMPLATE can be downloaded here. 

To use the template you must currently use MS EXCEL 2007 or higher. Hopefully we can get other formats of this created, but think this is a start to help out with analysis of log2timeline data.

To learn how to create timelines: Read these articles

  1. Download it - Open Timeline Color Template
  2. Switch to Color Timeline worksheet/tab
  3. Click on Cell A-1
  4. Select 'DATA' Ribbon
  5. Import Data "FROM TEXT"
  6. Select log2timeline.csv file
  7. TEXT IMPORT WIZARD Will Start
  8. Step 1 -> Select Delimited ->Select NEXT
  9. Step 2 -> Unselect Tab under Delimiters -> Select Comma under Delimiters -> Select NEXT >
  10. Step 3 ->Select Finish
  11. Where do you want to put the data? Simply Select OK.
  12. Once imported View -> Freeze Panes -> Freeze Top Row
  13. Optional Hide Columns Timzone, User, Host, Short or Desc (keep one of these), Version
  14. Select HOME Ribbon
  15. Select all Cells "CTRL-A"
  16. In Home Ribbon -> Sort and Filter - Filter

Begin Analysis:

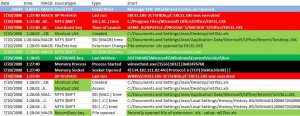
Your chart should now look like this once you start filtering your data to the elements you are looking for.

chart1excel.jpg

Another Example

chart2excel.jpg

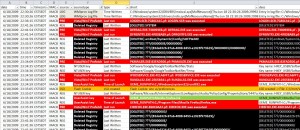
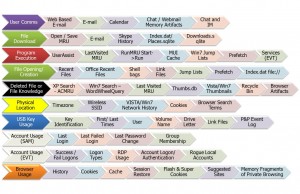
This chart will also help you with analysis of the colorized artifacts from our FOR408 Windows In-Depth Course

chart3excel.jpg

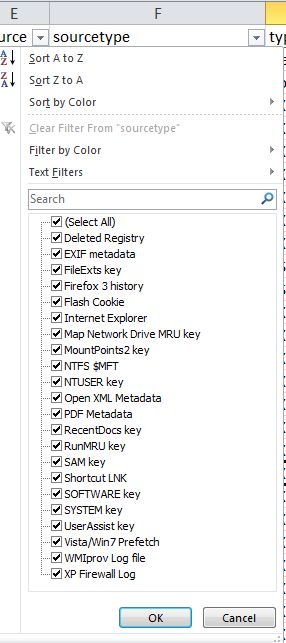
To select specific artifacts of interest you can select them from the source, sourcetype, type, or short columns. Below is an example of FILTERING using the drop down filter for the Sourcetype column. If you wanted look for specific data types and eliminate others, this is a great place to start.

chart4excel.jpg

More articles on analysis techniques are coming, but the color spreadsheet needs some polish still. If you have feedback, please email me at rlee "at" sans.org with feedback or updates that can make it even better.

Rob Lee has over 15 years of experience in digital forensics, vulnerability discovery, intrusion detection and incident response. Rob is the lead course author and faculty fellow for the computer forensic courses at the SANS Institute and lead author for FOR408 Windows Forensics and FOR508 Advanced Computer Forensics Analysis and Incident Response.

SANS Digital Forensics and Incident Response Blog | Digital Forensic SIFTing: Colorized Super Timeline Template for Log2timeline Output Files | SANS Institute