SEC504: Hacker Tools, Techniques, and Incident Handling
SEC504Offensive Operations


As any incident responder will agree, you can never have too many logs. That is, of course, until you have to analyze them! I was recently on an engagement where our team had to review hundreds of gigabytes of logs looking for evidence of hacking activity. I was quickly reminded of how much I love Microsoft Log Parser.
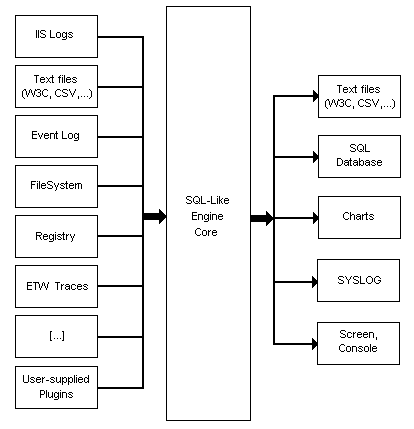
Log Parser is often misunderstood and underestimated. It could possibly be the best forensic analysis tool ever devised. Imagine having the ability to take almost any chunk of data and quickly search it using SQL-based grammar. That's Log Parser in a nutshell. It is a lightweight SQL-based search engine that operates on a staggering number of different input types (see Figure 1). Yes, I know that tools like Splunk and Sawmill are built around this same idea, but keep in mind that Log Parser was written in the year 2000. I am constantly amazed at the power it affords the forensic analyst, and you can't beat the price (free). Save perhaps memory analysis, there isn't much it can't accomplish for an incident responder.
In my mind, two things have limited the use of Log Parser in the forensics community: the command-line requirement and the fear of SQL queries. Neither is much of an obstacle, and since this is a how-to, let's debunk both.
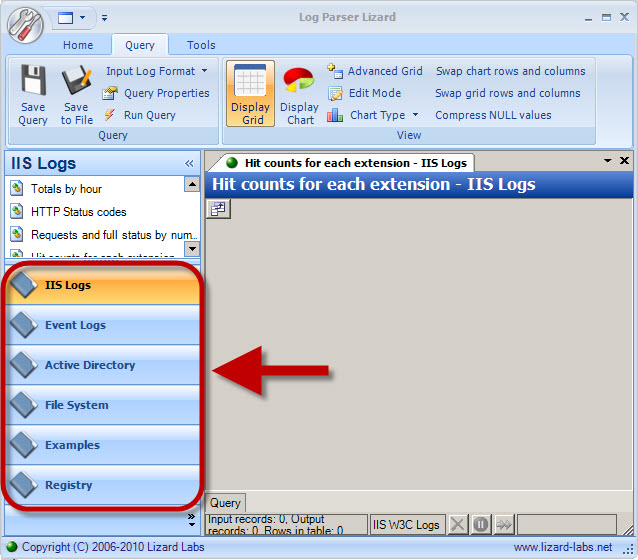
Log Parser's command-line isn't particularly onerous, but when staring at logs all day, I'm not afraid to admit that I prefer a GUI. There are several free options available, but I find Log Parser Lizard to be head and shoulders above the competition [1]. A few notable features of Log Parser Lizard:
I find the last feature to be especially helpful because every incident is different, and I frequently tweak queries. It is nice to be able to look through my archive or save a new one for future use. I use an "Examples" folder to save interesting solutions so I can refer back to them when building complicated searches.
The Internet is rife with excellent examples of Log Parser queries. I'll cover a few here and provide some links to more comprehensive lists [2] [3] [4]. To really learn Log Parser I recommend grabbing some sample data, doing a Google search, and just playing with whatever queries strike your fancy. Like any computer language, there are multiple ways to achieve the same results, and taking the time to understand different queries is a quick way to learn the various functions and syntax. Do not be overwhelmed — you can create very powerful queries with a very limited Log Parser vocabulary. As an example, consider the following query:
SELECT
EXTRACT_EXTENSION(cs-uri-stem) as Extension,
Count(*) as Total
FROM [IIS logs]
GROUP BY Extension
ORDER by Total DESC
I often run this query because it gives me a quick view of the different file types that were requested from the web server. Breaking this down into its components, the SELECT clause tells Log Parser what elements of the log file we wish to display. Cs-uri-stem is an IIS log field that records the page requested from the web server [5]. The FROM clause tells Log Parser what the inputs will be. SELECT and FROM are the only required elements of a query. The GROUP BY clause is necessary when using an aggregate function, like "Count", to give the total requests for each extension. Finally, the ORDER clause is optional but tells Log Parser to order the displayed results according to the value of Total in descending order (DESC).
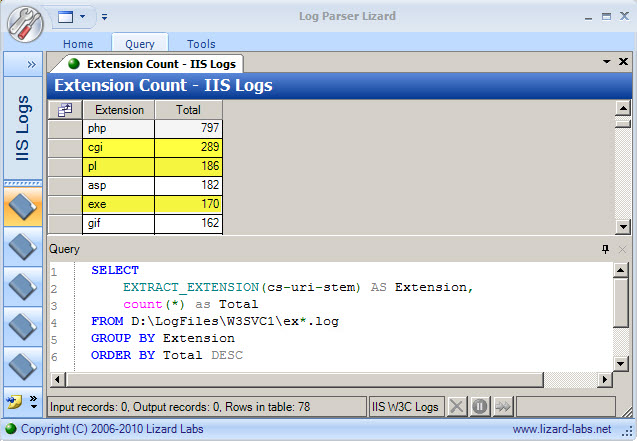
The output in Figure 3 gives me a good starting point for my review. Knowing the multitude of CGI vulnerabilities that exist, I would certainly want to look deeper there. Similarly, I would also plan to investigate what .pl and .exe files are being accessed on the webserver. The next step is to run a follow-up query:
SELECT
EXTRACT_EXTENSION(cs-uri-stem) as Extension,
sc-status as StatusCode,
Count(*) as Attempts
FROM [IIS logs]
WHERE Extension = 'cgi'
GROUP BY Extension, StatusCode
ORDER by Attempts DESC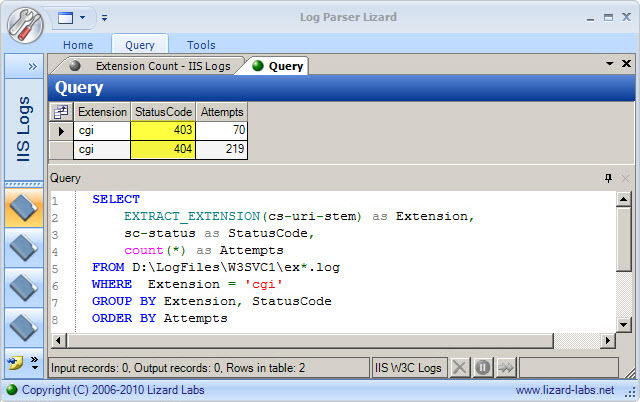
I added two items to this query. The first, sc-status, provides the HTTP status code for the request, indicating whether the web requests were successful (200s) or unsuccessful (typically 400s and 500s) [6]. The second addition is the WHERE clause, giving the ability to filter my results. In this case, I indicated I only wanted to see the count of status codes for files with a CGI extension. The WHERE clause is incredibly helpful for culling output and is the backbone of many Log Parser Queries. Looking at the results in Figure 4, I can see there were no successful requests for CGI files on this server. They were either not found (404) or the server refused to respond to the request (403).
A final action might be to take a look at some of the CGI queries to determine whether the errors were due to misconfigurations or nefarious activity. Since I want to see all fields from the logs related to CGI files, my query will be quite simple (* indicates all fields):
SELECT *
FROM [IIS logs]
WHERE EXTRACT_EXTENSION(cs-uri-stem) = 'cgi'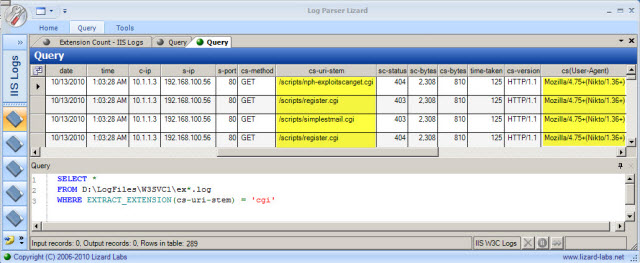
A quick review of the results in Figure 5 shows requests for several suspicious CGI files as well as a browser user agent of "Nikto". Based on this information, I can surmise that this web server was scanned using the Nikto vulnerability scanner on 10/13/10 at 1:03:28 UTC.
The key takeaway is that during a log review, you will be running multiple queries to cut across a massive amount of data. By slicing the data in different ways, you have a much better chance of finding anomalous or malicious activity than if you were to attempt to review the logs manually.
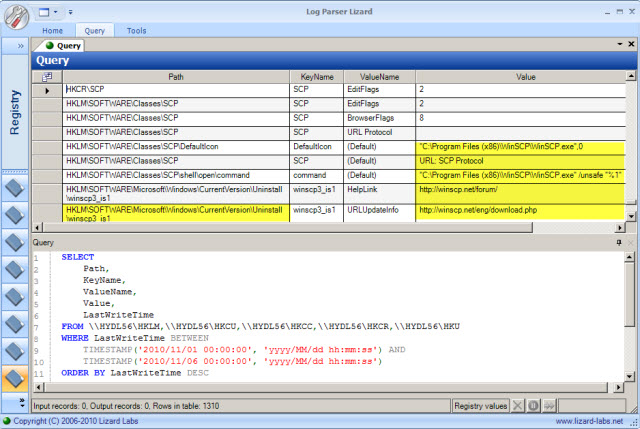
Log Parser has a myriad of uses other than just parsing text files. The Windows Registry is a great example of a very large binary file that Log Parser can natively search. Figure 6 shows an example of sorting the Registry by LastWriteTime. In this case, I asked Log Parser to return the Path, KeyName, ValueName, Value, and LastWriteTime of any Registry entry updated between 11/1/10 and 11/6/10 from the HKLM, HKCU, HKCC, HKCR, and HKU hives. This system was suspected of being compromised at the beginning of November, and we were looking for any changes precipitated by the intruders. Among other things, the results make it clear that WinSCP was installed on the system during that timeframe.
You might have noticed in my query that I specified a machine name, \HYDL56, for each hive. This notation allows querying of remote machines over the network. It is particularly useful if you are searching multiple systems for a specific indicator of compromise. Alternatively, I could have run the same query on the local machine by just specifying the hives of interest (HKLM, HKCU, ...). This is a good example of when the command line version can be helpful, particularly when built into live response scripts.
Unfortunately I am not aware of any easy way to use Log Parser to query offline Registry files that we might pull from a forensic image. The current version of Log Parser does not accept offline Registry files as input. If you were truly motivated, you could extract data from the Registry hives in text form and pipe to Log Parser, but it would need to be a special case to be worth the effort.
Start with high-level queries, and view your logs from many different perspectives
Reviewing HTTP status codes, looking for excessively long URI stems and queries, and searching for known bad keywords like "xp_cmdshell" are all excellent ways to identify SQL injection. By looking for the same attacks in different ways, you increase your chances of finding that needle in the haystack.
Use the principle of Least Frequency of Occurrence
Malicious activity on your system is by definition anomalous and will usually be some of the least frequent events on a system. Use Log Parser to trend activity such as hourly hits to critical .aspx pages and look for data that stands out. If you see thousands of 404 errors in your logs and only a few 403 errors, or a grouping of abnormal entries at 1AM on Saturday, those items might be worth investigating.
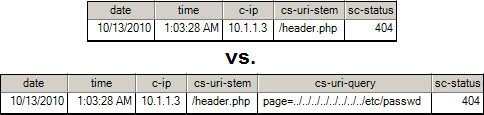
Request more data elements than you think you need
Often times a more in-depth investigation can be avoided with just a little more information. As an example, sometimes adding the web request query string (cs-uri-query) is much more helpful than just reviewing the page requested (cs-uri-stem) alone (Figure 7).
Get familiar with the built-in functions
Log Parser includes 80+ supporting functions that can greatly simplify queries. I used EXTRACT_EXTENSION in the examples above, and there are many others like EXTRACT_PATH, EXTRACT_FILENAME, STRLEN, TO_LOWERCASE, etc. [7]
Take advantage of the copious documentation available
I have only touched on a few of Log Parser's capabilities. It can slice and dice Event Logs (both .EVT and .EVTX) with aplomb. You can perform complicated searches of a live file system, including using functions like HASHMD5_FILE to compare MD5 hashes. Remote systems can be queried and large scale searches of Active Directory objects can be performed. Once you learn the basics, its power is really only limited by your creativity. Log Parser installs with excellent documentation, and there is even an entire book on the subject [8].
Chad Tilbury, GCFA, has spent over ten years conducting computer crime investigations ranging from hacking to espionage to multi-million dollar fraud cases. He teaches FOR408 Windows Forensics and FOR508 Advanced Computer Forensic Analysis and Incident Response for the SANS Institute. Find him on Twitter @chadtilbury or at http://ForensicMethods.com.
